

File:IDO-MetabolicTrap-MECFS.png

Original file (1,099 × 1,140 pixels, file size: 228 KB, MIME type: image/png)
Summary[edit | edit source]
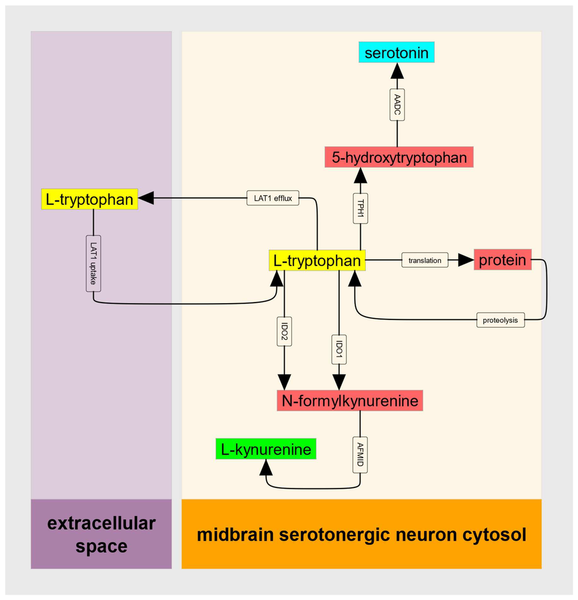
"Diagram of the kinetic model of the IDO metabolic trap. Colored rectangles represent molecules in either extracellular space or serotonergic neuron cytosol. Arrows represent processes including transport and biochemical reactions. LAT1 = large neutral amino acid transporter (SLC7A5:SLC3A2), IDO = indoleamine-2,3-dioxygenase, AFMID = arylforamidase, TPH = tryptophan hydroxylase, AADC = aromatic amino acid decarboxylase."
Authors: Phair, Davis and Kashi (2019) Source: https://www.mdpi.com/2075-4418/9/3/82 Citation: Diagnostics (9)3 p82 Figure 2 doi 10.3390/diagnostics9030082
Licensing[edit | edit source]
 |
This file is licensed under the Creative Commons Attribution 4.0 International license. | |
|
File history
Click on a date/time to view the file as it appeared at that time.
| Date/Time | Thumbnail | Dimensions | User | Comment | |
|---|---|---|---|---|---|
| current | 17:25, July 29, 2019 | | 1,099 × 1,140 (228 KB) | Notjusttired (talk | contribs) | "Diagram of the kinetic model of the IDO metabolic trap. Colored rectangles represent molecules in either extracellular space or serotonergic neuron cytosol. Arrows represent processes including transport and biochemical reactions. LAT1 = large neutral... |
You cannot overwrite this file.
File usage
The following page uses this file: