

File:T-cell-types ME CFS.jpg
Original file (765 × 1,276 pixels, file size: 482 KB, MIME type: image/jpeg)
Summary[edit | edit source]
Title: (or description)[edit | edit source]
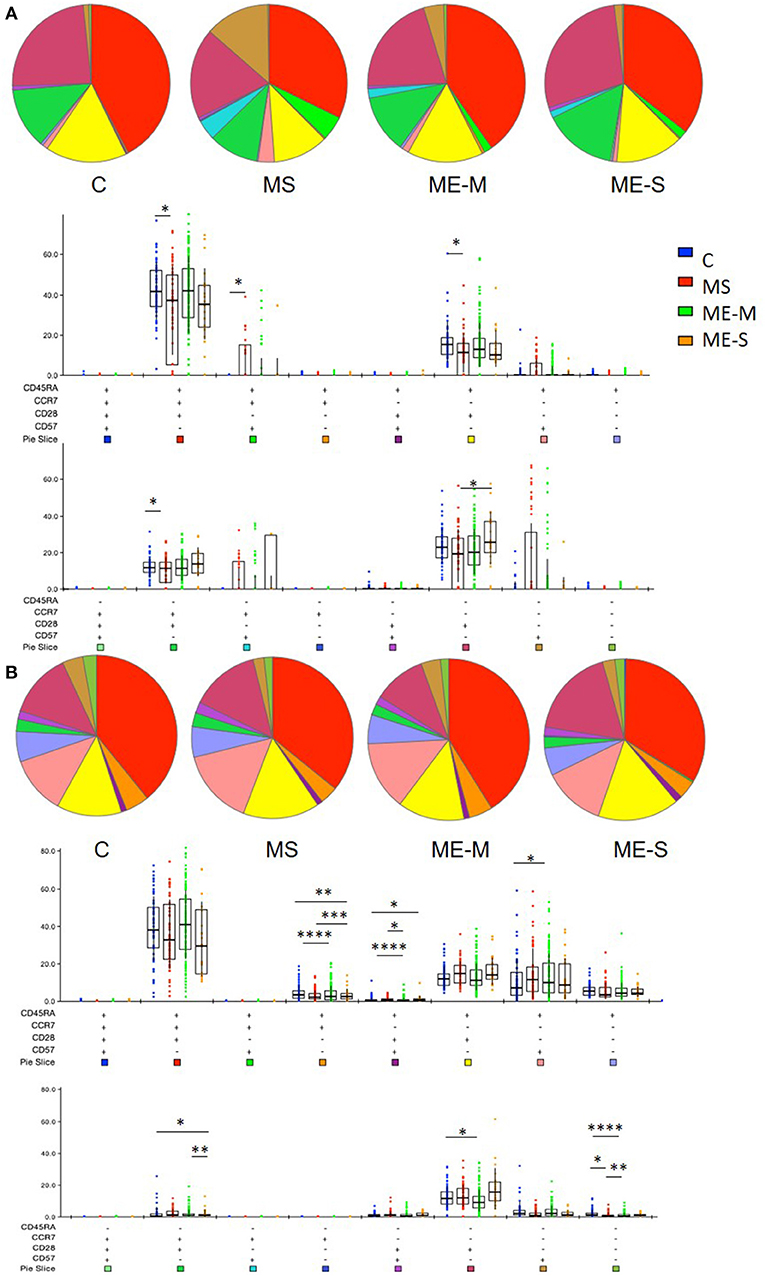
Proportions of differentiated T cell populations in people with ME/CFS, people with MS and healthy controls. CD4+ (A) and CD8+ (B) T cells were analysed for CCR7, CD45RA, CD28, and CD57 co-expression to quantify proportions of T cells expressing combinations of these markers. The pie charts show the median average proportions of each cell type in each clinical group. In the bar and whisker plots, cell populations were compared between clinical groups for multiple comparisons for each cell differentiation subtype, with only significant (P < 0.05) results shown. The colour under each cell phenotype bar chart shows its representation in the pie charts.
- P < 0.05, **P < 0.01, ***P < 0.001, ****P < 0.0001.
Key: Healthy controls (C), multiple sclerosis (MS), mild/moderate ME/CFS (ME-M), and severely affected ME/CFS (ME-S).
Author: (or citation)[edit | edit source]
Cliff JM, King EC, Lee J-S, Sepúlveda N, Wolf A-S, Kingdon C, Bowman E, Dockrell HM, Nacul L, Lacerda E and Riley EM (2019) Cellular Immune Function in Myalgic Encephalomyelitis/Chronic Fatigue Syndrome (ME/CFS). Front. Immunol. 10:796. doi: 10.3389/fimmu.2019.00796
Figure 5
Source: (e.g. internet address)[edit | edit source]
https://www.frontiersin.org/articles/10.3389/fimmu.2019.00796/full
Other information:[edit | edit source]
See also[edit | edit source]
- List of abnormal findings in chronic fatigue syndrome and myalgic encephalomyelitis
- Severe and very severe ME
Licensing[edit | edit source]
 |
This file is licensed under the Creative Commons Attribution 4.0 International license. | |
|
File history
Click on a date/time to view the file as it appeared at that time.
| Date/Time | Thumbnail | Dimensions | User | Comment | |
|---|---|---|---|---|---|
| current | 13:34, June 27, 2020 | | 765 × 1,276 (482 KB) | Notjusttired (talk | contribs) | ==== Title: (or description) ==== Proportions of differentiated T cell populations in people with ME/CFS, people with MS and healthy controls. CD4+ (A) and CD8+ (B) T cells were analysed for CCR7, CD45RA, CD28, and CD57 co-expre... |
You cannot overwrite this file.
File usage
There are no pages that use this file.