

File:T-cells-ME-CFS.jpg
Original file (1,084 × 553 pixels, file size: 212 KB, MIME type: image/jpeg)
Summary[edit | edit source]
Title: (or description)[edit | edit source]
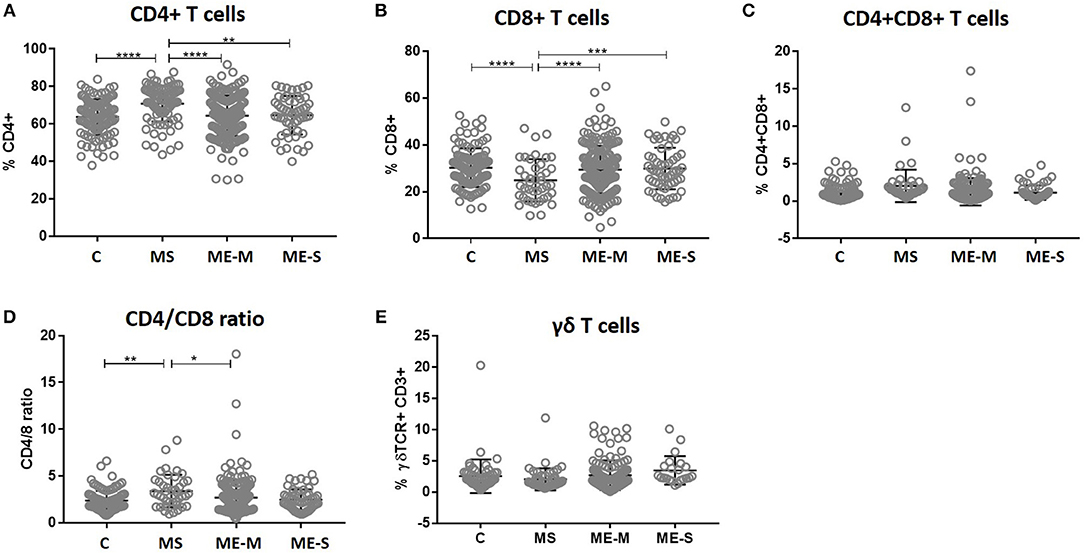
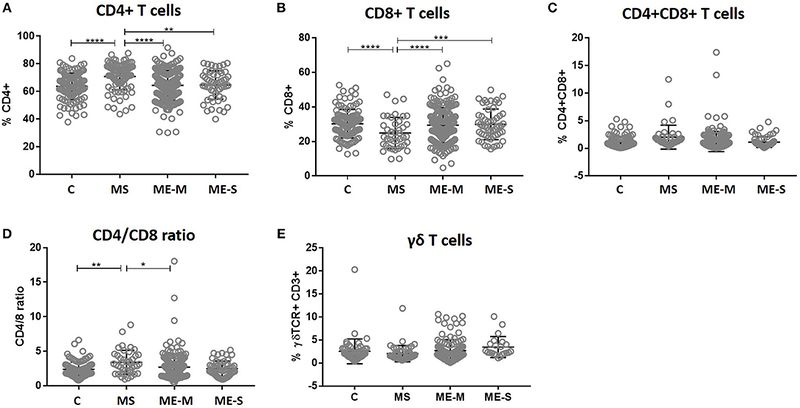
T cell subset quantification in PBMC from people with ME/CFS, people with MS and healthy controls. Within the T cell gate (CD3+), the CD4+ and CD8 staining was characterised to calculate the proportion of (A) CD4+ T cells, (B) CD8+ T cells, (C) double positive CD4+CD8+ T cells, and (D) the ratio of CD4+:CD8+ T cells. (E) The proportion of T cells which expressed the γδ TCR within the CD3+ T cell population were determined. Key: Healthy controls (C), multiple sclerosis (MS), mild/moderate ME/CFS (ME-M), and severely affected ME/CFS (ME-S).
Author: (or citation)[edit | edit source]
Cliff JM, King EC, Lee J-S, Sepúlveda N, Wolf A-S, Kingdon C, Bowman E, Dockrell HM, Nacul L, Lacerda E and Riley EM (2019) Cellular Immune Function in Myalgic Encephalomyelitis/Chronic Fatigue Syndrome (ME/CFS). Front. Immunol. 10:796. doi: 10.3389/fimmu.2019.00796
Figure 3
Source: (e.g. internet address)[edit | edit source]
https://www.frontiersin.org/articles/10.3389/fimmu.2019.00796/full
Other information:[edit | edit source]
See also[edit | edit source]
- List of abnormal findings in chronic fatigue syndrome and myalgic encephalomyelitis
- Severe and very severe ME
Licensing[edit | edit source]
 |
This file is licensed under the Creative Commons Attribution 4.0 International license. | |
|
File history
Click on a date/time to view the file as it appeared at that time.
| Date/Time | Thumbnail | Dimensions | User | Comment | |
|---|---|---|---|---|---|
| current | 13:27, June 27, 2020 | | 1,084 × 553 (212 KB) | Notjusttired (talk | contribs) | ==== Title: (or description) ==== T cell subset quantification in PBMC from people with ME/CFS, people with MS and healthy controls. Within the T cell gate (CD3+), the CD4+ and CD8 staining was characterised to calculate the proportion... |
You cannot overwrite this file.
File usage
There are no pages that use this file.